How Kelp and SQD Enable Interactive Onchain Analytics
Example project showcasing a tool to analyze price impact on Uniswap
Regardless of whether you believe that alternative Layer-1s will become the backbone of Web3 or that L2s will facilitate widespread adoption, the data they generate daily is already the Terabytes.
The ledger sizes of legacy blockchains, such as Bitcoin or Ethereum, have surpassed 5000 and 1000 GB, respectively, and this is just onchain data. Add to that other native chains, L2s, and even L3s, and the amount of information is staggering.
This presents a unique challenge for businesses operating in the space. For one, they need to access data to build their projects, but they might often be in the dark about success metrics when it’s hard to retrieve and analyze data. In a modular multichain blockchain ecosystem, there are few tools (if any) with the analytical capabilities necessary to make real-time decisions.
That seems contradictory in a space where real-time monitoring would be all the more valuable for risk management, threat prevention, and optimizing tech for demand.
SQD has built a decentralized stack that facilitates querying onchain data at scale without relying on RPC access to blockchain nodes. Instead, SQD ingests the data in its decentralized data lake in the form of parquet files, which offers builders a playground where they can define their own schema and queries for retrieval. The infrastructure already supports 150+ EVM chains, L2s, and native Virtual Machines such as Solana.
With the data access problem solved, the only thing missing are operational tools to derive critical insights from the data.
Kelp is filling that gap with its visual development platform. It's designed to simplify the development of data processing and data visualization tools using an intuitive drag-and-drop interface. With a comprehensive library of data connectors, operators, and UI widgets, users can build powerful applications faster than with traditional coding. It supports secure and reliable connections to nearly any REST and GraphQL APIs, databases, and SSE streams, providing seamless integration with existing infrastructures and data sources.
With Kelp and SQD, you can transform onchain data into actionable insights and operational tools.
Analyzing the Price Impact on Uniswap
To illustrate, we built a tool that helps analyze the change in the price of a token resulting from a trade on the Uniswap Dex.
- Uniswap uses liquidity pools rather than traditional order books. Prices are set algorithmically based on the ratio of tokens in the pool.
- Understanding and managing price impact is crucial for traders on Uniswap to optimize their trades and minimize costs associated with large price swings.
- Each trade affects the balance of tokens in the pool. Large trades relative to the pool size cause significant shifts in the token ratio, leading to greater price impact.
- High price impact leads to higher slippage (the difference between the expected price of a trade and the actual executed price), making trades more expensive for the trader.
- Larger pools tend to have a lower price impact for a given trade size because the token ratio changes less dramatically. Conversely, smaller pools are more susceptible to large price swings from individual trades.
Example
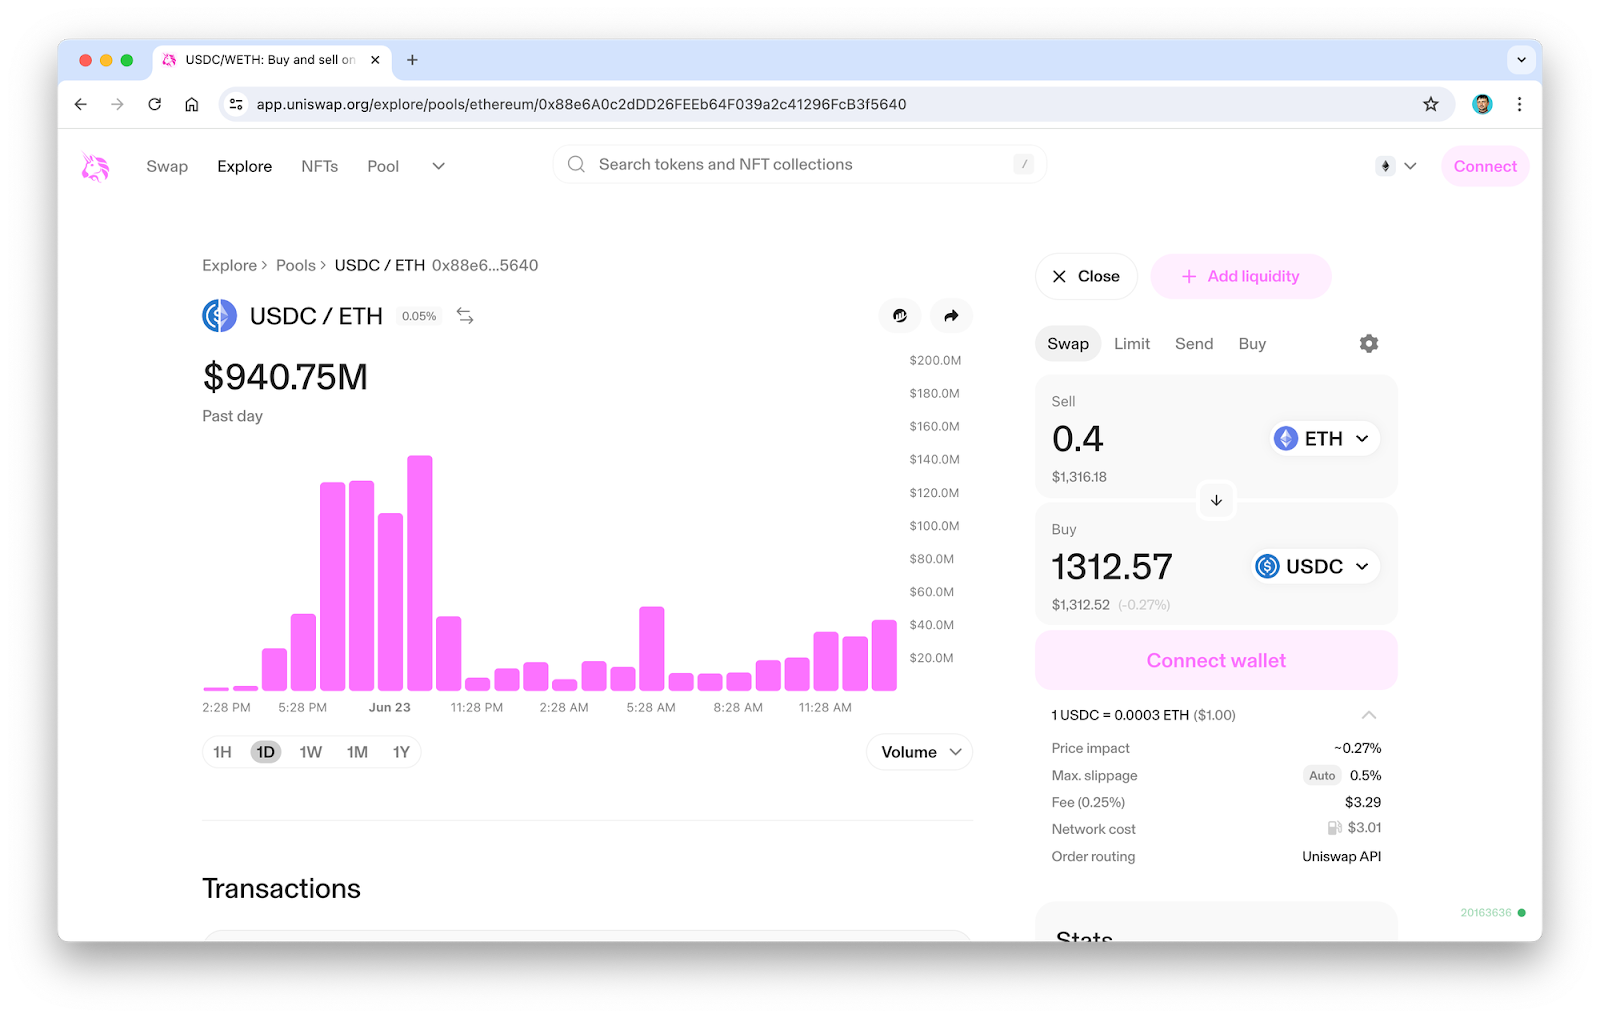
The example below shows a low price impact. In this transaction, the price impact rate results in a slight loss of 0.053%.
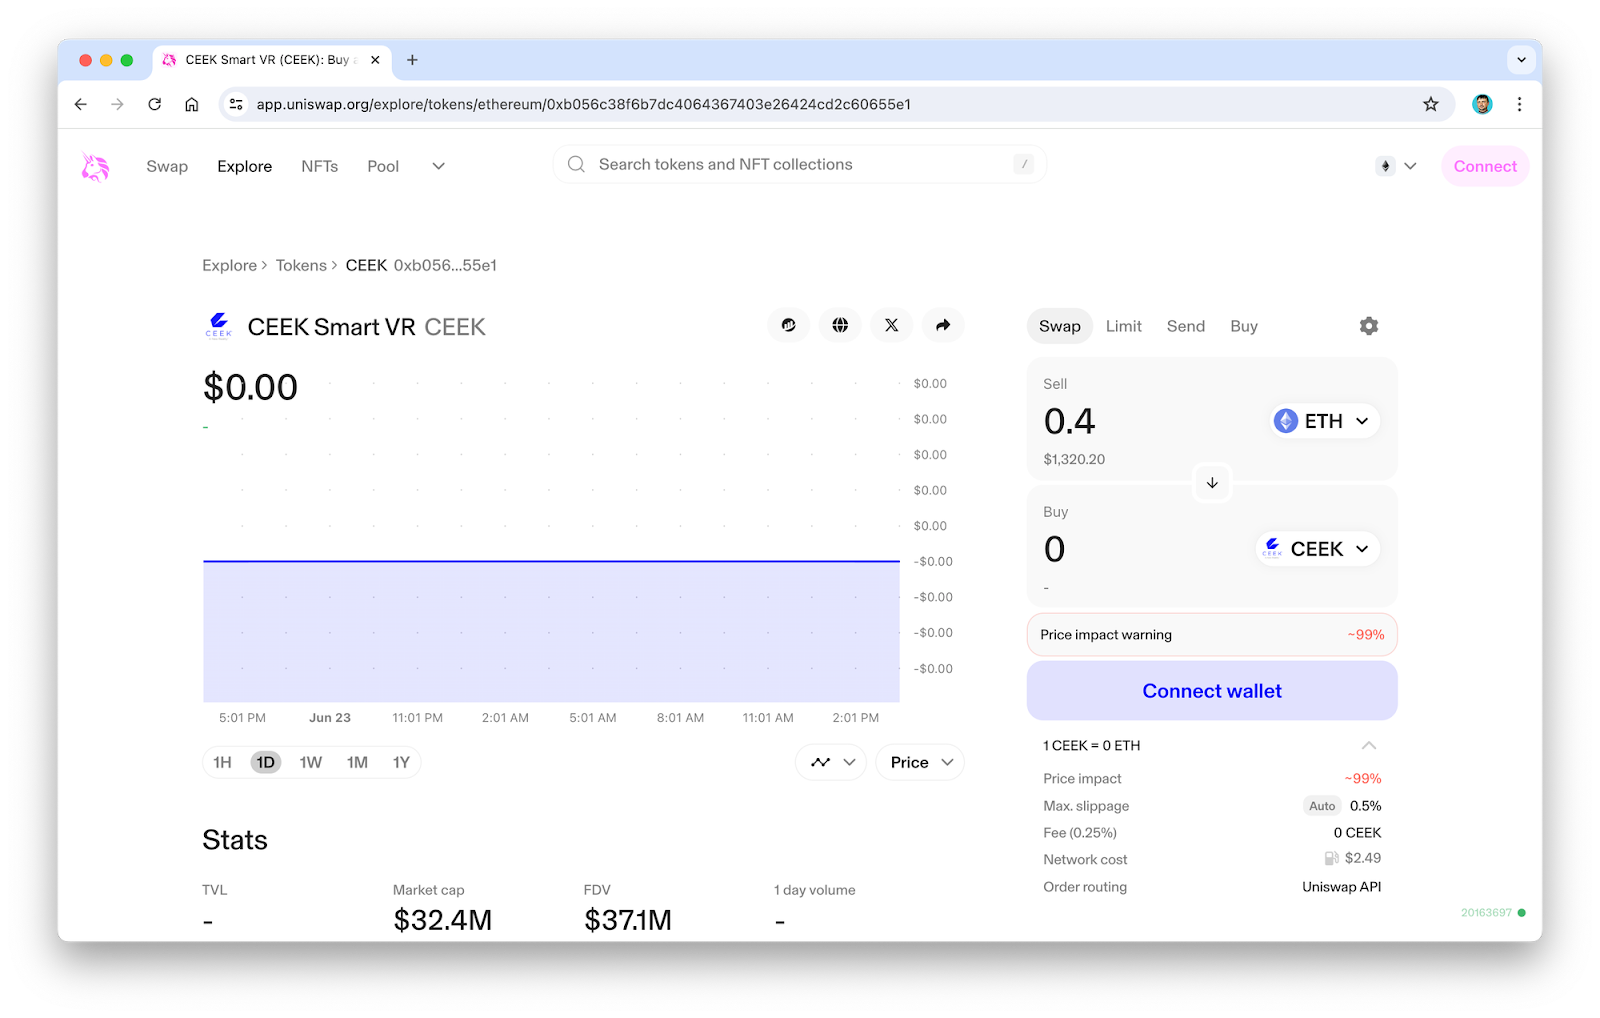
The following example shows a high price impact. In this scenario, Uniswap will initiate a price impact warning because you will likely experience a significant loss.
To mitigate price impact, traders have several options. Splitting a large trade into smaller trades can help reduce price impact, though this may not always be feasible due to gas fees. Trading in pools with higher liquidity is another option, as it reduces price impact by ensuring that the ratio change for a given trade size is smaller. Additionally, traders can set slippage tolerance to control the maximum acceptable price impact. If the price moves beyond this threshold during execution, the trade will not execute.
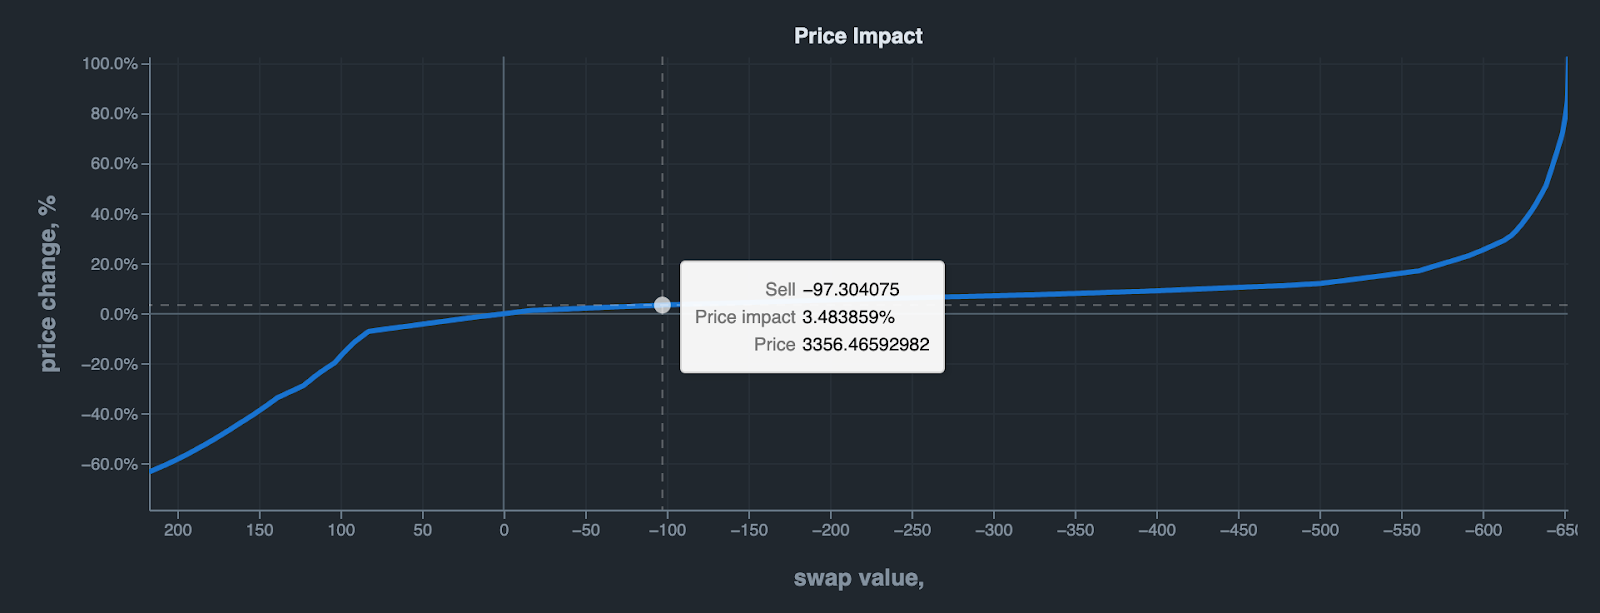
Without special tools, it may be hard to reason about it. Visualizing the chart of price change in relation to the trade value offers several benefits for traders and liquidity providers on Uniswap. Traders can better plan their trades by understanding how different trade sizes will impact the price. Liquidity providers can assess how their liquidity impacts the pool and adjust their contributions to optimize returns. Both traders and liquidity providers can gain insights into the liquidity depth of different pools, understanding how robust or fragile a pool is to large trades.
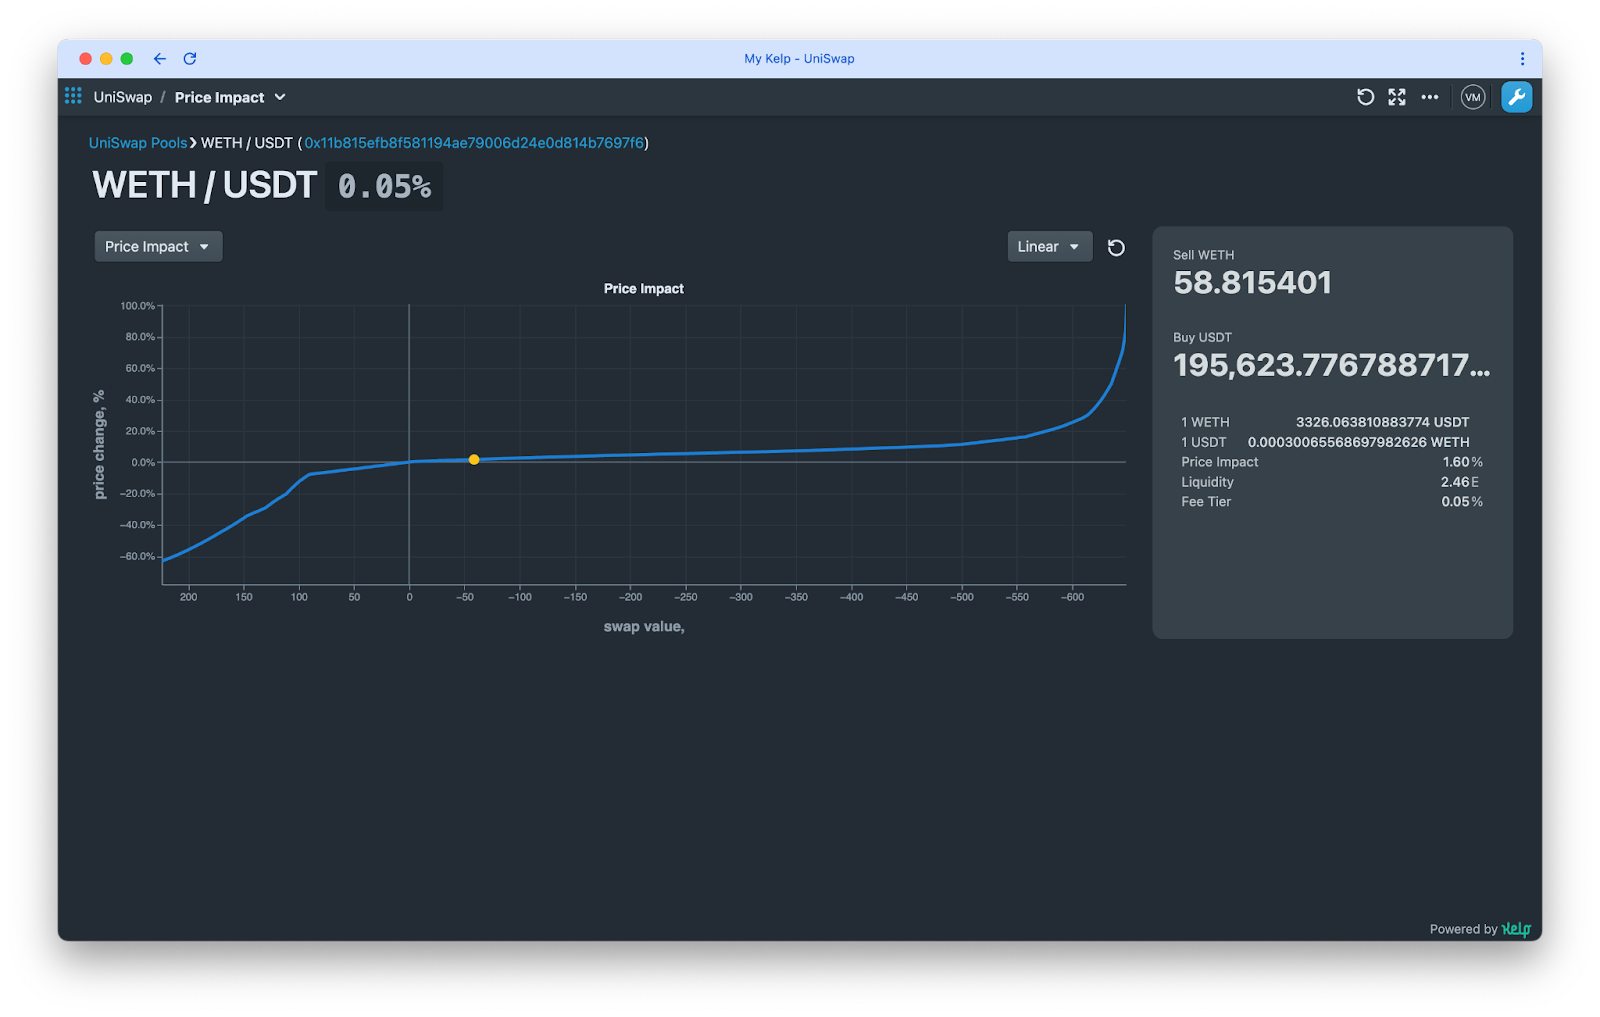
Explore a visualization of the Price Impact chart implemented on Kelp using the data feed from SQD. You can also fork this app and customize it for your own use case. For the math behind the calculations, use the following resources:
Conclusion
Visualizing on-chain data transforms complex blockchain information into actionable insights, offering significant value to both traders and developers.
For traders, it enhances decision-making, risk management, and strategy development by providing precise and accessible data on various metrics, including price impacts, market trends, liquidity levels, etc.
For developers, it improves user experience, facilitates efficient monitoring, and fosters transparency and trust through intuitive interfaces and real-time analytics.
Beyond these two groups, practical insights and flexible dashboards are also beneficial for researchers and crypto businesses.
By making on-chain data more understandable and usable, visualization tools empower users to optimize their interactions with decentralized finance systems and contribute to a more robust and transparent blockchain ecosystem overall.
Using the SQD data lake as a source of comprehensive blockchain data, combined with the flexible and interactive capabilities of the Kelp platform, users can create powerful tools tailored to their specific needs. The fusion of real-time data access and interactive visualization can transform the way we interact with and understand blockchain ecosystems.
"At Kelp, we're all about giving developers the tools to turn their ideas into reality. Visualizing and interacting with onchain data opens up so many possibilities. It's exciting to see what we can build together when we have the right data and tools at our disposal." — Vitaly Malyshev, CEO and Founder of Kelp
“This collaboration is a unique opportunity to showcase the power of SQD in surfacing blockchain data and how it can contribute to better decision-making. Kelp enables something that other analytics tools, such as Dune Analytics, don’t: the ability to interact and figure out, for example, what the impact of a specific trade you have in mind will be. That is just one of countless potential use cases. ” - Dmitry Zhelezov, CEO and Co-Founder SQD
Stay tuned for future posts as our teams explore the technical details of building further tools to visualize and make sense of blockchain data.
Developers interested in leveraging the Kelp x SQD integration, please contact us on Discord.